
| 일 | 월 | 화 | 수 | 목 | 금 | 토 |
|---|---|---|---|---|---|---|
| 1 | 2 | 3 | 4 | 5 | 6 | |
| 7 | 8 | 9 | 10 | 11 | 12 | 13 |
| 14 | 15 | 16 | 17 | 18 | 19 | 20 |
| 21 | 22 | 23 | 24 | 25 | 26 | 27 |
| 28 | 29 | 30 | 31 |
Tags
- 도커
- Exchange 2003
- awx
- Azure
- AWS S3
- ADFS SSO
- ELK
- MSSQL 2012
- vCenter
- 하이퍼바이저
- ADFS Traffic Manager
- ELK 설치
- AWS EBS
- ADFS 구성 방법 및 이중화
- ADFS proxy
- Application Gateway
- AWS EFS
- Active Directory
- Kubernetes
- vSphere
- Exchange Server
- ADFS 이중화
- Docker
- mongodb 설치
- vCenter Syslog collector
- Active Directory Migration
- AWS
- ansible
- vmware vsphere
- AD Migration
Archives
- Today
- Total
practice makes perfect
ELK 설치 (with Azure Blob) 본문
- Azure 방화벽 및 Application GW (L7) 로그를 보다 쉽게 확인하기 위해 ELK를 구성한다
- Azure 환경에서 진행한다
- 테스트를 위해 1대 서버로 구성한다
- 로그는 Azure Blob에 적재되며 Logstash와 연동한다
- IP 및 Key 노출을 대비해 일부 정보는 공개하지 않음
1. ELK 설치 및 셋팅
$ yum -y install java-1.8.0-openjdk java-1.8.0-openjdk-devel
$ vi /etc/profile
##jdk path##
export JAVA_HOME=/usr/lib/jvm/java-1.8.0-openjdk-1.8.0.102-1.b14.el7_2.x86_64
export PATH=$PATH:$JAVA_HOME/bin
export CLASSPATH=.:$JAVA_HOME/jre/lib:$JAVA_HOME/lib:$JAVA_HOME/lib/tools.jar
$ source /etc/profile
$ /etc/yum.repos.d/
#vi elasticsearch.repo
[elasticsearch-6.x]
name=Elasticsearch repository for 6.x packages
baseurl=https://artifacts.elastic.co/packages/6.x/yum
gpgcheck=1
gpgkey=https://artifacts.elastic.co/GPG-KEY-elasticsearch
enabled=1
sslverify=0 #필요시
autorefresh=1
type=rpm-md
$ vi logstash.repo
[logstash-6.x]
name=Elastic repository for 6.x packages
baseurl=https://artifacts.elastic.co/packages/6.x/yum
gpgcheck=1
gpgkey=https://artifacts.elastic.co/GPG-KEY-elasticsearch
enabled=1
sslverify=0 #필요시
autorefresh=1
type=rpm-md
$ vi kibana.repo
[kibana-6.x]
name=Kibana repository for 6.x packages
baseurl=https://artifacts.elastic.co/packages/6.x/yum
gpgcheck=1
gpgkey=https://artifacts.elastic.co/GPG-KEY-elasticsearch
enabled=1
sslverify=0 #필요시
autorefresh=1
type=rpm-md
$ yum -y install elasticsearch
$ yum -y install logstash
$ yum -y install kibana
[Elasticsearch 설정]
$ vi /etc/elasticsearch/elasticsearch.yml
# ---------------------------------- Network -----------------------------------
#
# Set the bind address to a specific IP (IPv4 or IPv6):
#
network.host: 0.0.0.0
#
# Set a custom port for HTTP:
#
http.port: 9200
#
# For more information, consult the network module documentation.
#
[Kibana 설정]
$ vi /etc/kibana/kibana.yml
# Kibana is served by a back end server. This setting specifies the port to use.
server.port: 5601
# Specifies the address to which the Kibana server will bind. IP addresses and host names are both valid values.
# The default is 'localhost', which usually means remote machines will not be able to connect.
# To allow connections from remote users, set this parameter to a non-loopback address.
server.host: "0.0.0.0"
# The URLs of the Elasticsearch instances to use for all your queries.
elasticsearch.hosts: ["http://localhost:9200"]
[Logstash Azure Plugin 설치]
/usr/share/logstash/bin/
#./logstash-plugin install logstash-input-azureblob
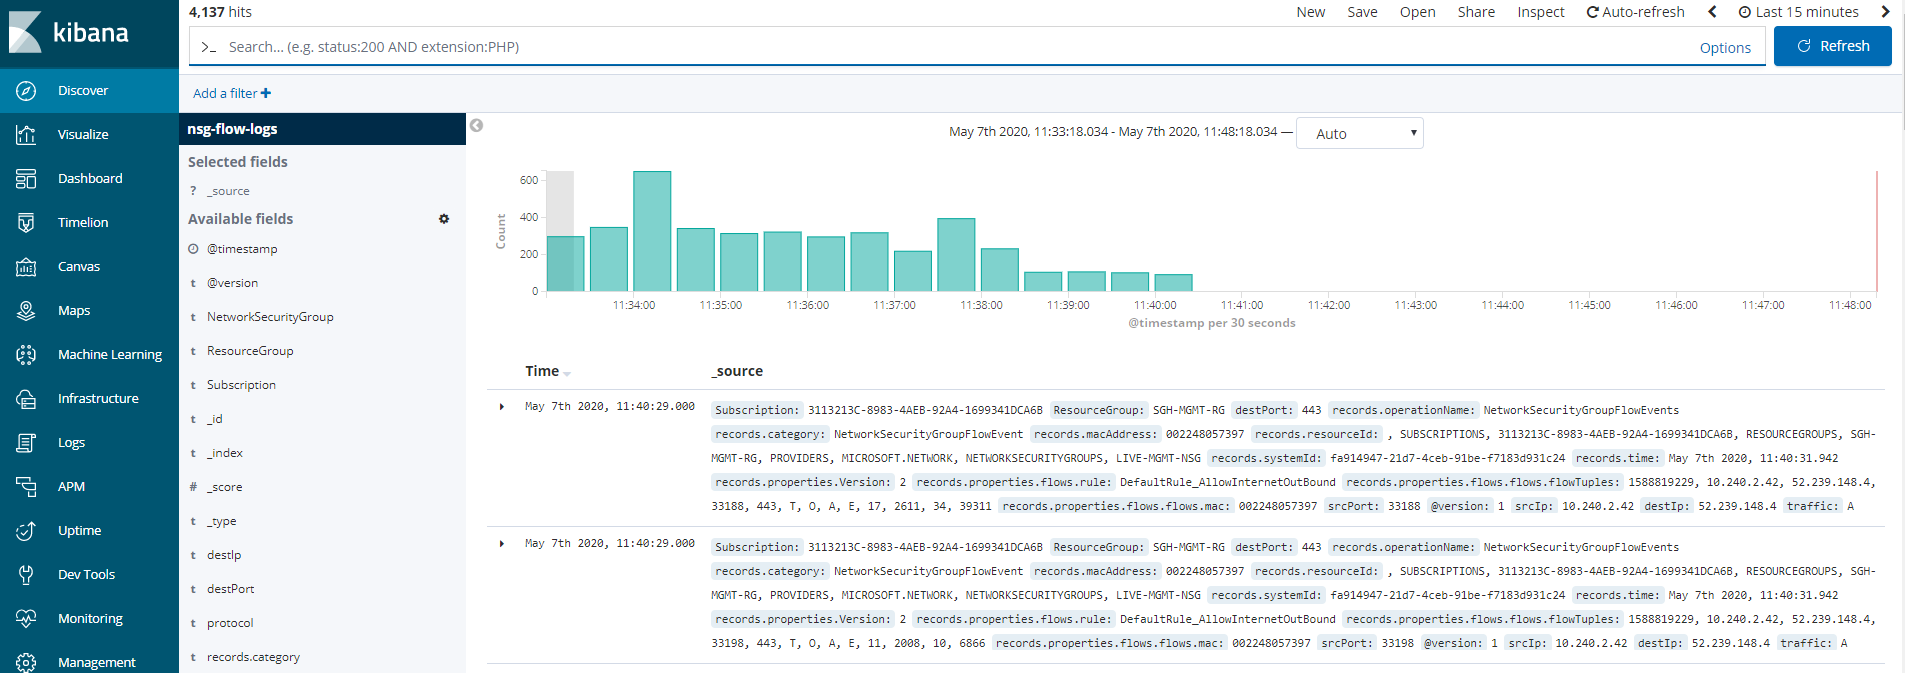
[Logstash 설정 (azure Blob with nsg log)]
$ vi /etc/logstash/conf.d/default.conf
input {
azureblob
{
storage_account_name => "azuremgmtdiagsa"
storage_access_key => "xxxxxxxxxxxxxxxxxxxxxxx"
container => "insights-logs-networksecuritygroupflowevent"
codec => "json"
# Refer https://docs.microsoft.com/azure/network-watcher/network-watcher-read-nsg-flow-logs
# Typical numbers could be 21/9 or 12/2 depends on the nsg log file types
file_head_bytes => 12
file_tail_bytes => 2
# Enable / tweak these settings when event is too big for codec to handle.
# break_json_down_policy => "with_head_tail"
# break_json_batch_count => 2
}
}
filter {
split { field => "[records]" }
split { field => "[records][properties][flows]"}
split { field => "[records][properties][flows][flows]"}
split { field => "[records][properties][flows][flows][flowTuples]"}
mutate{
split => { "[records][resourceId]" => "/"}
add_field => {"Subscription" => "%{[records][resourceId][2]}"
"ResourceGroup" => "%{[records][resourceId][4]}"
"NetworkSecurityGroup" => "%{[records][resourceId][8]}"}
convert => {"Subscription" => "string"}
convert => {"ResourceGroup" => "string"}
convert => {"NetworkSecurityGroup" => "string"}
split => { "[records][properties][flows][flows][flowTuples]" => ","}
add_field => {
"unixtimestamp" => "%{[records][properties][flows][flows][flowTuples][0]}"
"srcIp" => "%{[records][properties][flows][flows][flowTuples][1]}"
"destIp" => "%{[records][properties][flows][flows][flowTuples][2]}"
"srcPort" => "%{[records][properties][flows][flows][flowTuples][3]}"
"destPort" => "%{[records][properties][flows][flows][flowTuples][4]}"
"protocol" => "%{[records][properties][flows][flows][flowTuples][5]}"
"trafficflow" => "%{[records][properties][flows][flows][flowTuples][6]}"
"traffic" => "%{[records][properties][flows][flows][flowTuples][7]}"
}
convert => {"unixtimestamp" => "integer"}
convert => {"srcPort" => "integer"}
convert => {"destPort" => "integer"}
}
date{
match => ["unixtimestamp" , "UNIX"]
}
}
output {
stdout { codec => rubydebug }
elasticsearch {
hosts => "localhost"
index => "nsg-flow-logs"
}
}
$ systemctl start elasticsearch.service
$ systemctl start logstash
$ systemctl start kibana start
## Logstash Configuration Check ##
# sudo -u logstash /usr/share/logstash/bin/logstash --path.settings /etc/logstash -t
Sending Logstash's logs to /var/log/logstash which is now configured via log4j2.properties
Configuration OK
## Logstash > ES 데이터 PUT 확인 ##
curl -XGET '10.2.211.58:9200/indexname/_search?pretty'
curl -XGET '10.2.211.58:9200/forti_checkin_log/_search?pretty'
## 정상적으로 들어가는지 확인 ##
$ curl 10.2.211.58:9200/_cat/indices?v
health status index uuid pri rep docs.count docs.deleted store.size pri.store.size
yellow open forti_checkin_log n86P-dZDRYCQVStIC0mNIw 5 1 9 0 63.7kb 63.7kb
yellow open test_index sNk5gZYaR7yd8xJQu8YhCw 5 1 7 0 54.5kb 54.5kb
yellow open clg_pageview_log tRC3ikmIQ3aGtxBaJ-rZXg 5 1 1342 0 434.1kb 434.1kb
yellow open clg_content_search IdRZzh1PSvSH9fup8l0sXg 5 1 306 14 481.7kb 481.7kb
yellow open erms_integration UU9obVsORv-vt-7y6Grv2Q 5 1 154 8 2.9mb 2.9mb
yellow open deptinfo_search vjMw7j5CTsa7n2oMdGgzWQ 5 1 668 0 4.2mb 4.2mb
## Logstash 로컬 로그 저장 ##
output {
elasticsearch {
hosts => "10.2.211.58:9200"
index => "forti_checkin_log"
}
file {
path => "/var/log/logstash/test.log"
}
stdout { codec => rubydebug }
}
## ES 정상 여부 확인 ##
$curl localhost:9200
{
"name" : "8cZrOJJ",
"cluster_name" : "elasticsearch",
"cluster_uuid" : "-EfWl3cARQqccC6OvfTLFg",
"version" : {
"number" : "6.8.8",
"build_flavor" : "default",
"build_type" : "rpm",
"build_hash" : "2f4c224",
"build_date" : "2020-03-18T23:22:18.622755Z",
"build_snapshot" : false,
"lucene_version" : "7.7.2",
"minimum_wire_compatibility_version" : "5.6.0",
"minimum_index_compatibility_version" : "5.0.0"
},
"tagline" : "You Know, for Search"
}
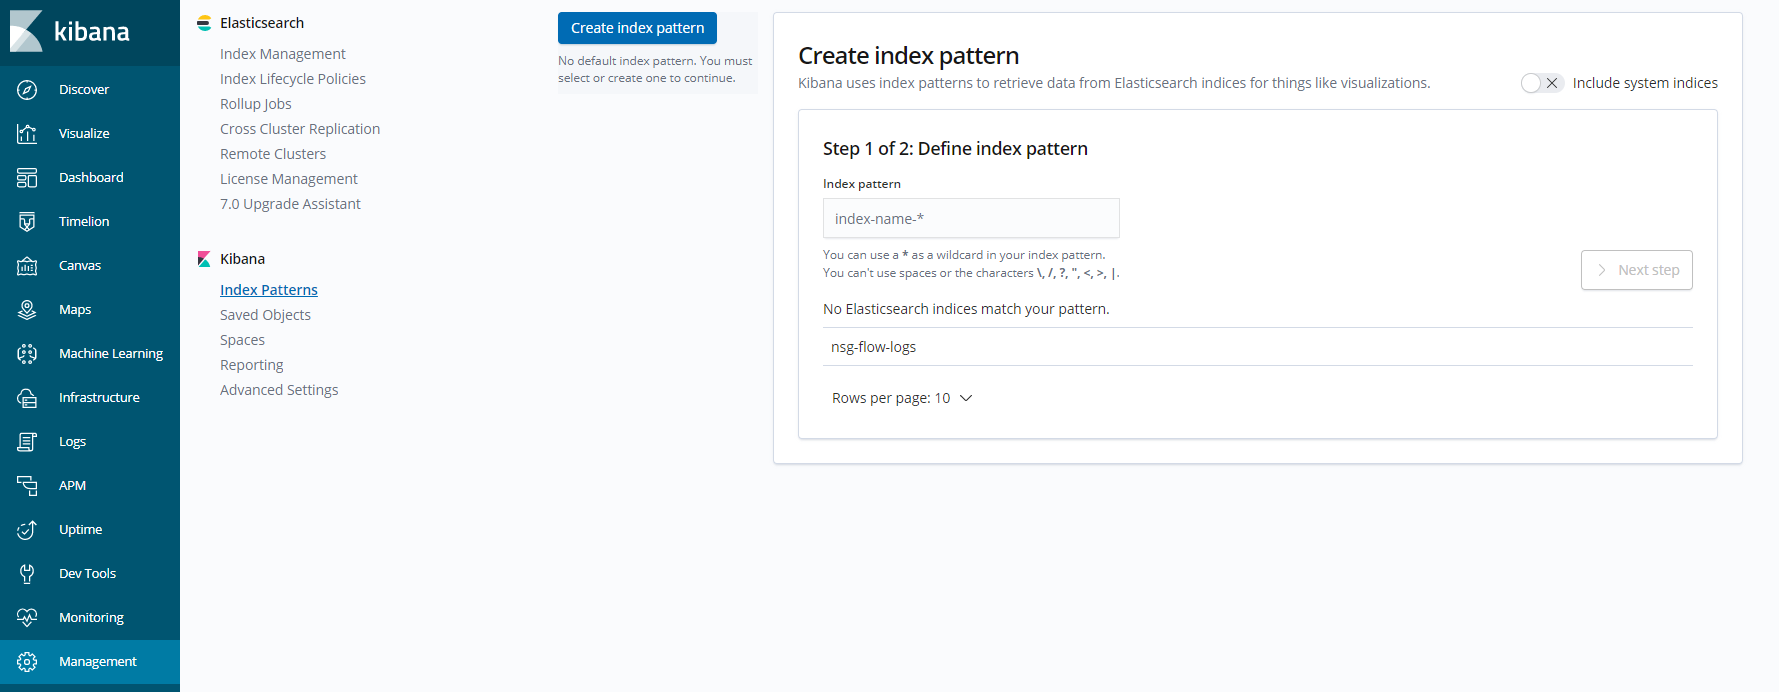
2. Kibana
- kibana 접속해본다 (http://ip:5601)
- 패턴추가


3. Appication GW (L7) 로그 추가
$ Logstash 설정

input {
   azureblob
     {
         type => "appgw-access"
         storage_account_name => "mgmtdiagsa"
         storage_access_key => xxxxxxxxxxxxxxxxxxxxxxxxx"
         container => "insights-logs-applicationgatewayaccesslog"
         codec => "json"
         # Refer https://docs.microsoft.com/en-us/azure/network-watcher/network-watcher-read-nsg-flow-logs
         # Typical numbers could be 21/9 or 12/2 depends on the nsg log file types
         # file_head_bytes => 21
         # file_tail_bytes => 9
     }
   }

filter {
 json {
      source => "message"
 }
 grok {
      match => [ "resourceId", "/%{NOTSPACE}/%{NOTSPACE}/%{NOTSPACE}/%{NOTSPACE:ResourceName}/%{NOTSPACE}/%{NOTSPACE}/%{NOTSPACE}/%{NOTSPACE:ApplicationGWName}" ]
 }
 mutate {
      remove_field => [ "resourceId" ]
 }
}

output {
  stdout { codec => rubydebug }
  elasticsearch {
        hosts => "localhost"
        index => "appgw-access-logs"
  }
}
[참고] Azure Application GW 로그 참고하여 logstash 구성
{ "timeStamp": "2020-05-07T09:00:06+00:00",
    "resourceId": "/SUBSCRIPTIONS/xxx/RESOURCEGROUPS/xxx/PROVIDERS/MICROSOFT.NETWORK/APPLICATIONGATEWAYS/xxx",
    "listenerName": "xx-https-listener",
    "ruleName": "xx-rt-https-rule",
    "backendPoolName": "xx-appgw-be-pool",
    "backendSettingName": "xx-http-setting",
    "operationName": "ApplicationGatewayAccess",
    "category": "ApplicationGatewayAccessLog",
    "properties": {
        "instanceId":"appgw_2",
        "clientIP":"1.1.1.1",
        "clientPort":46079,
        "httpMethod":"GET",
        "requestUri":"\/sockjs\/info",
        "requestQuery":"cb=dmw4q10n6g",
        "userAgent":"Mozilla\/5.0 (Windows NT 10.0; Win64; x64) AppleWebKit\/537.36 (KHTML, like Gecko) Chrome\/81.0.4044.138 Safari\/537.36",
        "httpStatus":200,
        "httpVersion":"HTTP\/1.1",
        "receivedBytes":607,
        "sentBytes":368,
        "timeTaken":0.002,
        "sslEnabled":"on",
        "sslCipher":"ECDHE-RSA-AES256-GCM-SHA384",
        "sslProtocol":"TLSv1.2",
        "sslClientVerify":"NONE",
        "sslClientCertificateFingerprint":"",
        "serverRouted":"10.x.x.x:4000",
        "serverStatus":"200",
        "serverResponseLatency":"0.000",
        "host":"xx.xx.net"
    }
}'Monitoring' 카테고리의 다른 글
| 모니터링 시스템 모듈 사용 구조 (0) | 2024.05.06 |
|---|
Comments